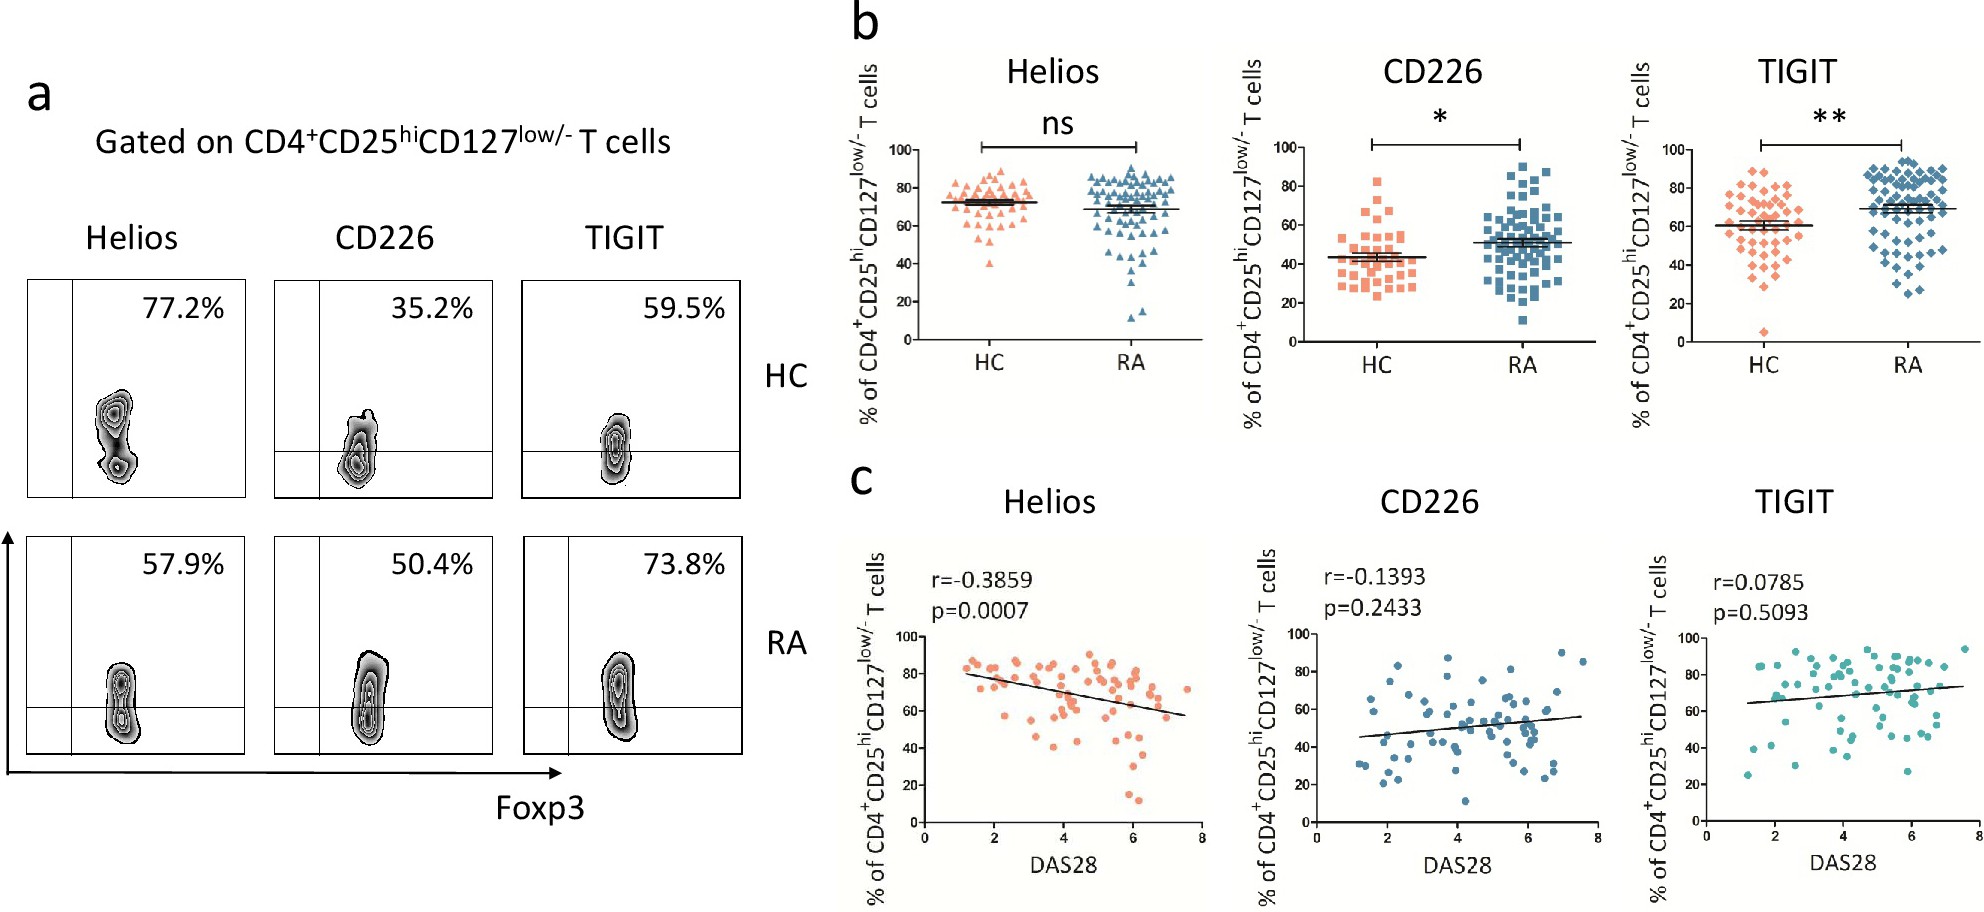
Fig. 3. Expression of Helios in Tregs, CD226 and TIGIT on Tregs in RA patients and their correlation with disease activity. (a) Helios, CD226, TIGIT expression in or on peripheral blood Tregs was detected by using flow cytometry. (b) The expression levels of Helios in Tregs were compared between HCs (72.35±9.25%) and RA patients (68.69±16.463%) (p>0.05) (left); the expression levels of CD226 on Tregs were compared between HCs (43.54±13.70%) and RA patients (50.84±16.91%) (p<0.05) (middle); and the expression levels of TIGIT on Tregs were compared between HCs (60.44±16.68%) and RA patients (69.23±17.75%) (p<0.01) (right). The p value was measured with Mann-Whitney test. n.s., not significant, * and ** indicate p <0.05 and p <0.01, respectively. (c) The expression of Helios in Tregs was negatively correlated with DAS28 score (r=-0.3859, p=0.0007) (left), and the expression of CD226 (middle) and TIGIT (right) were not associated with DAS28 score (p>0.05). Correlation analyses were carried out using Spearman's rank correlation test.